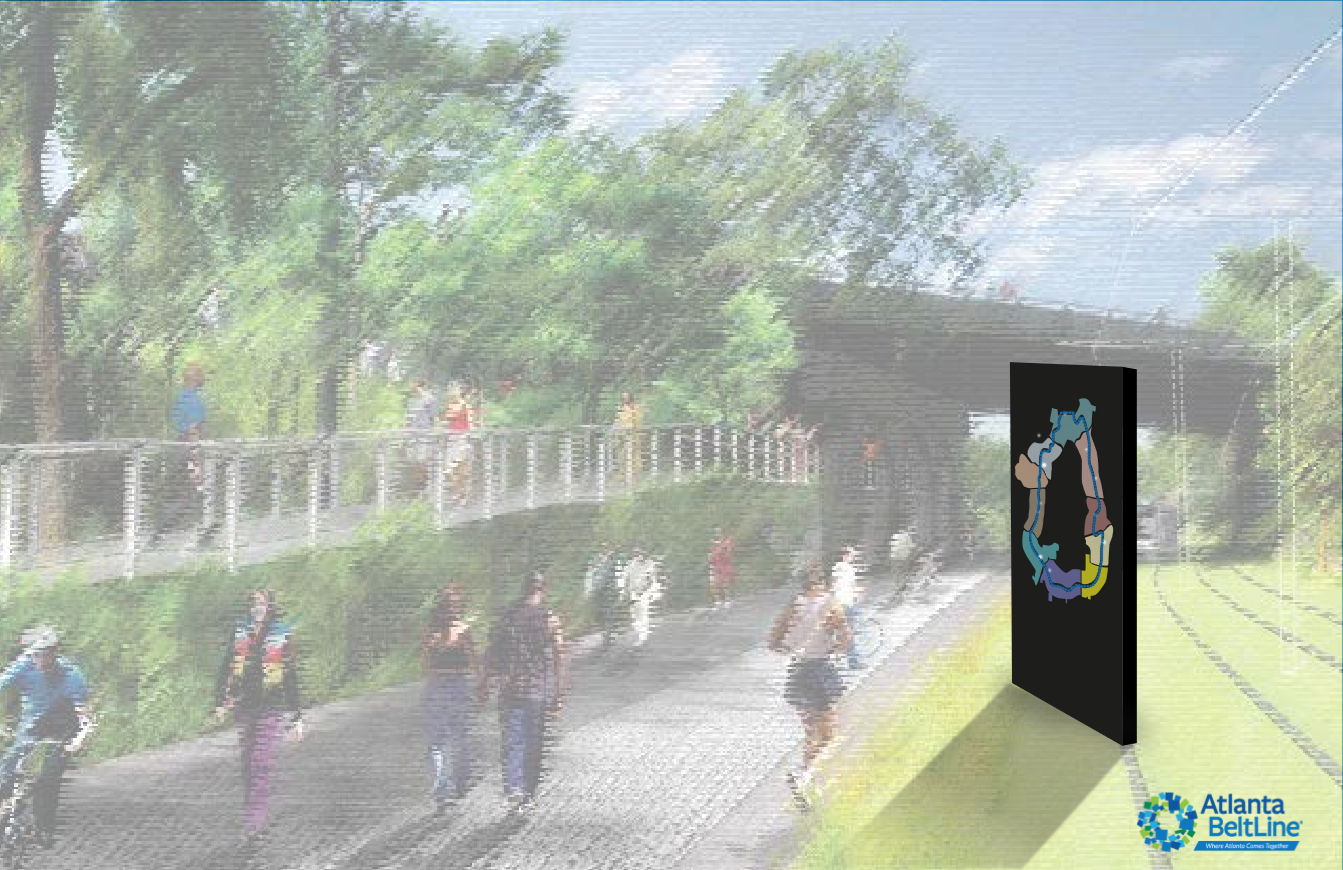
The Atlanta BeltLine is a walking and biking pathway along a former railway corridor that is slated to connect in a full loop around the city.
We propose to create compelling interactive and living map installations powered by the IOT, big data, and sensors along the Atlanta BeltLine to promote connected communities, foster curiosity, and eliminate stigma among the various neighborhoods.
Users will benefit from connected communities through informative and ever-changing displays. These living installations will display information about the pathway in the form of a traditional map, and feature constantly changing and flowing information from sensing modules in each individual neighborhood, highlighting local culture and current events, such as music, sound level, and activity types in the area.
Overview Video
Conceptualization
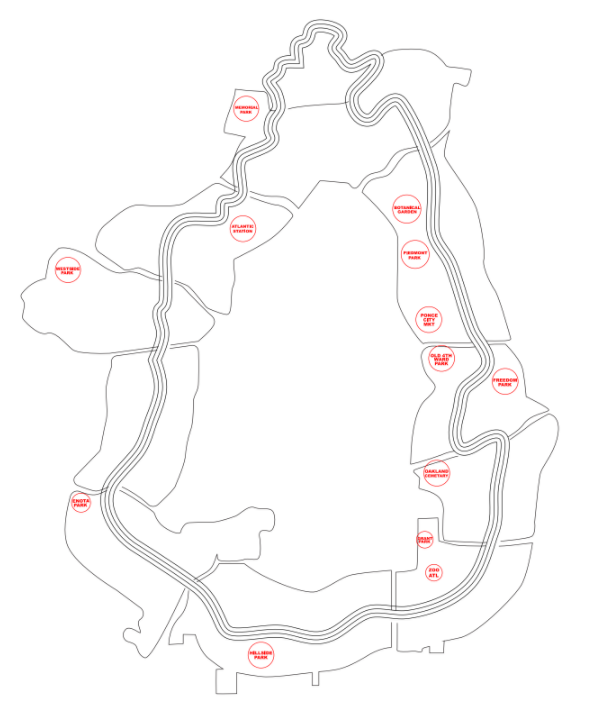
Map of Proposed Completed Atlanta Beltline. Live activity tracking would be a novel way to communicate the value of the greenspace
The Atlanta BeltLine began as a project to implement a multi-use trail on Atlanta’s unused railway corridor. This mixed-use trail has known immense success in the few years it has existed. In 2016, the Beltline received more than 1.7 million visitors.
Recent controversy has surrounded this growth with rising property values calling many to question if the Beltline is in fact an engine of gentrification. These concerns are the very reason that make this unique urban feature the ultimate canvas for innovation. Beltline represents the unique qualities of the city, melding the industrial past with the wide array of current cultures through a colorful, creative, and technological future.
In the face of gentrification, we believe in the calculated and thoughtful use of technology and art to help unify Atlanta.
In the face of gentrification, we believe in the calculated and thoughtful use of technology and art to help unify Atlanta.


The Beltline is a vibrant landscape for a variety of social interaction and community, when implemented responsibly.
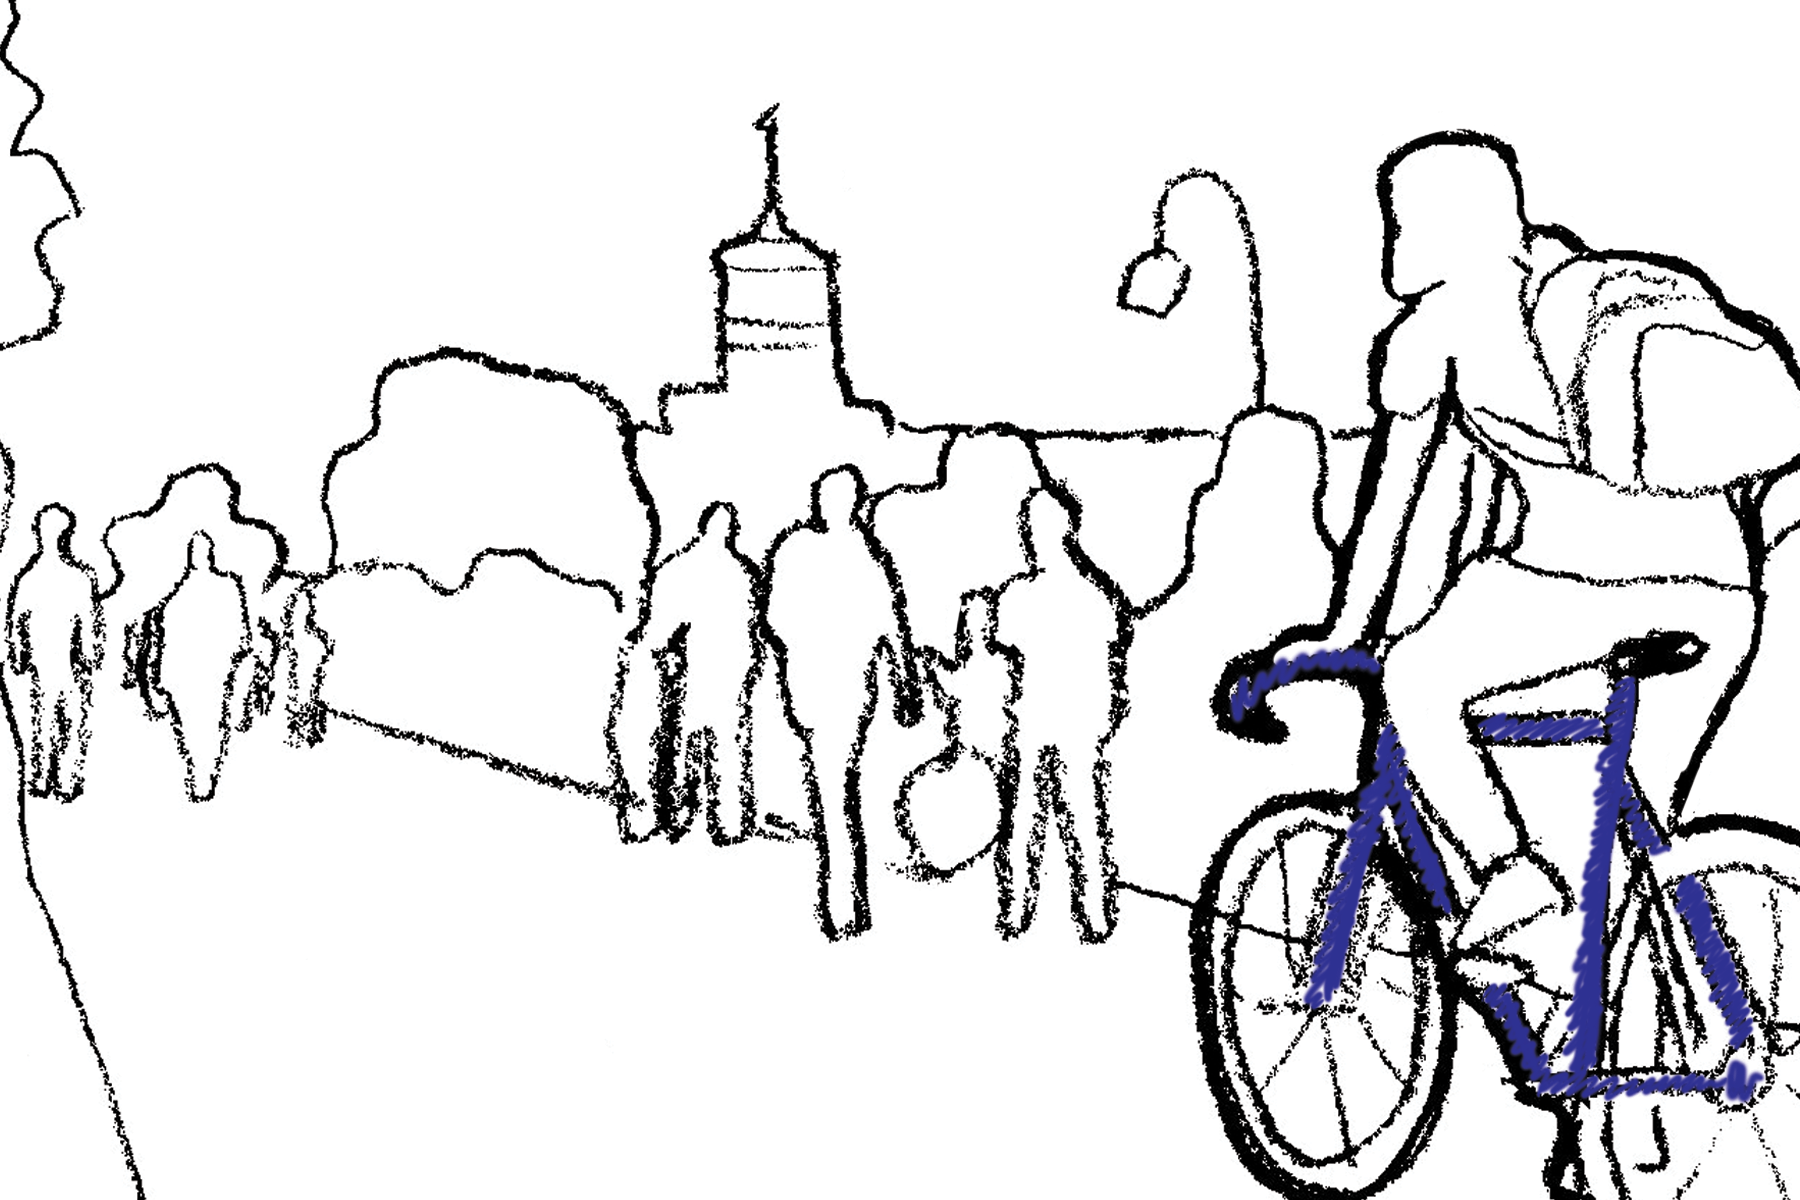
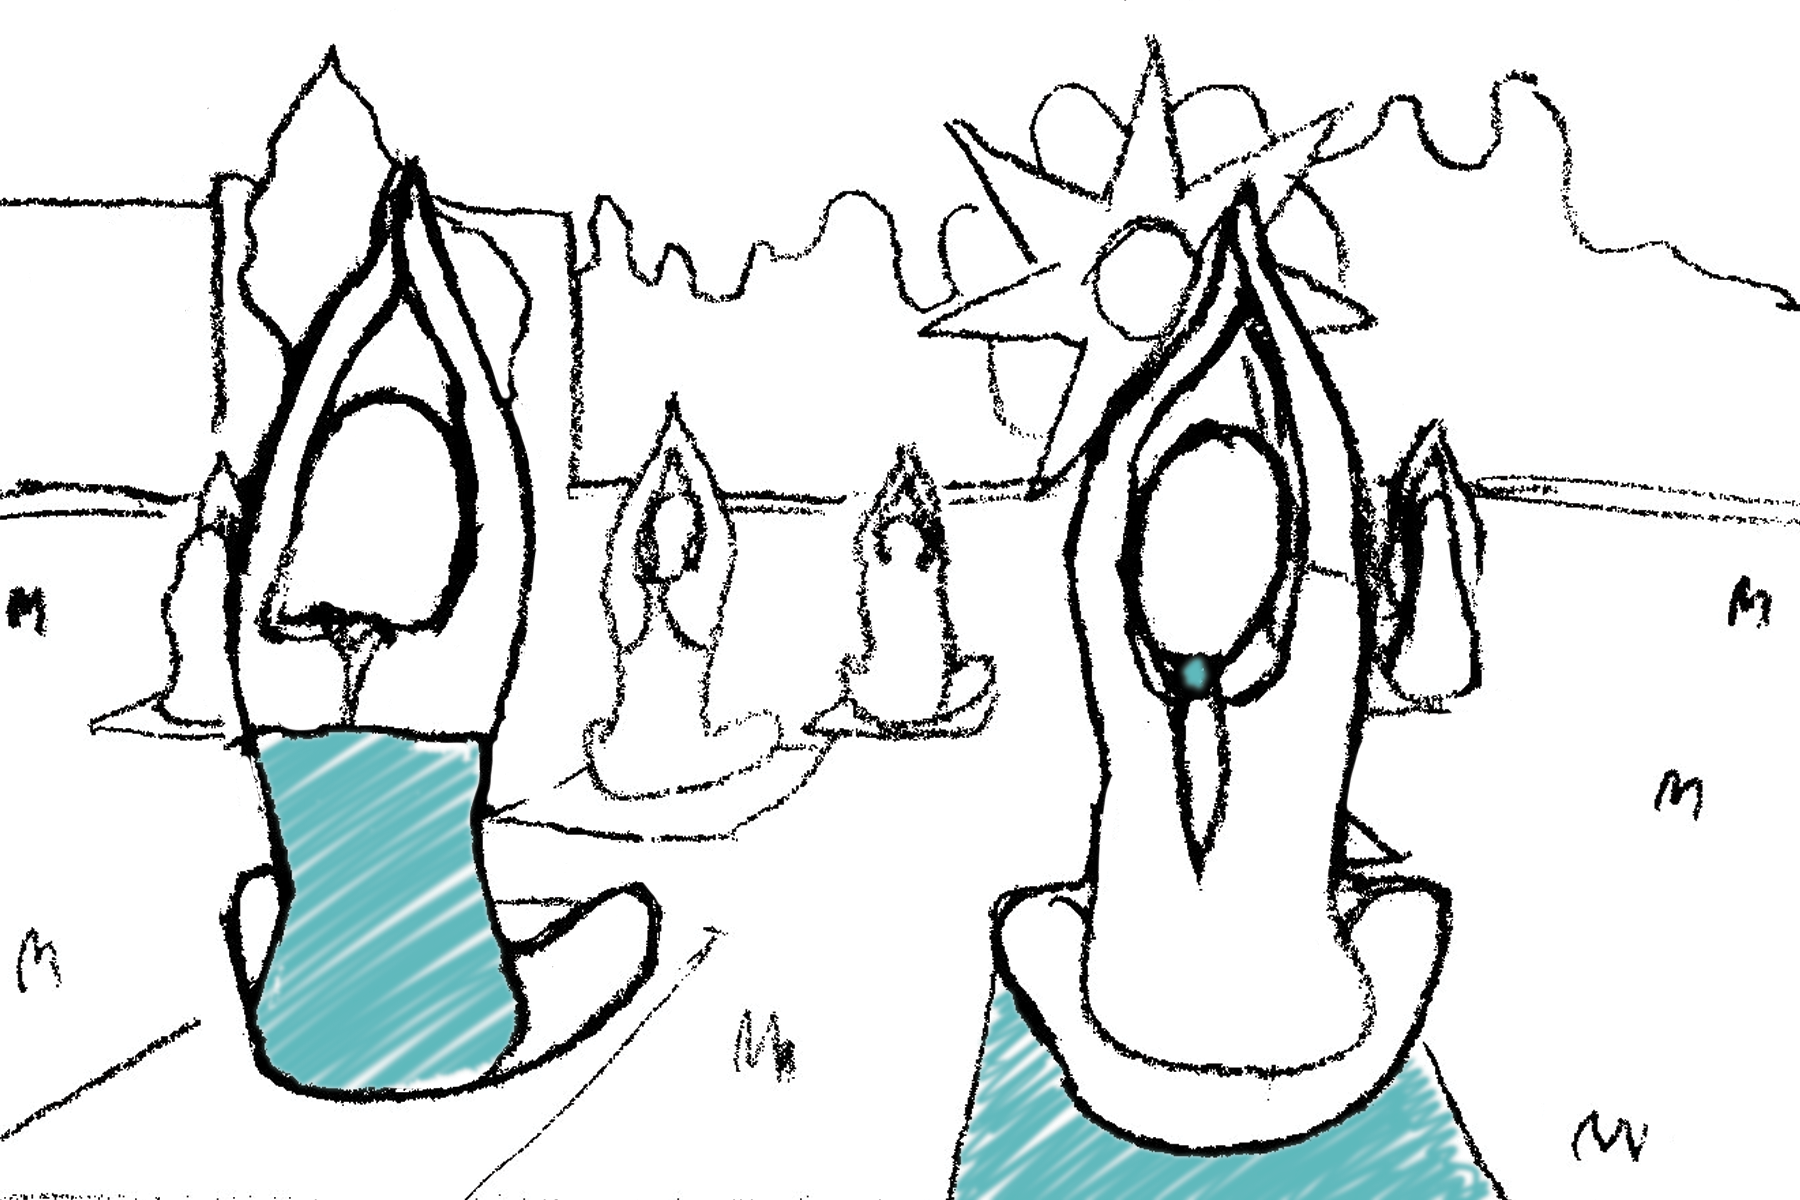
Sketches courtesy of Meghana Melkote
Sketches courtesy of Meghana Melkote
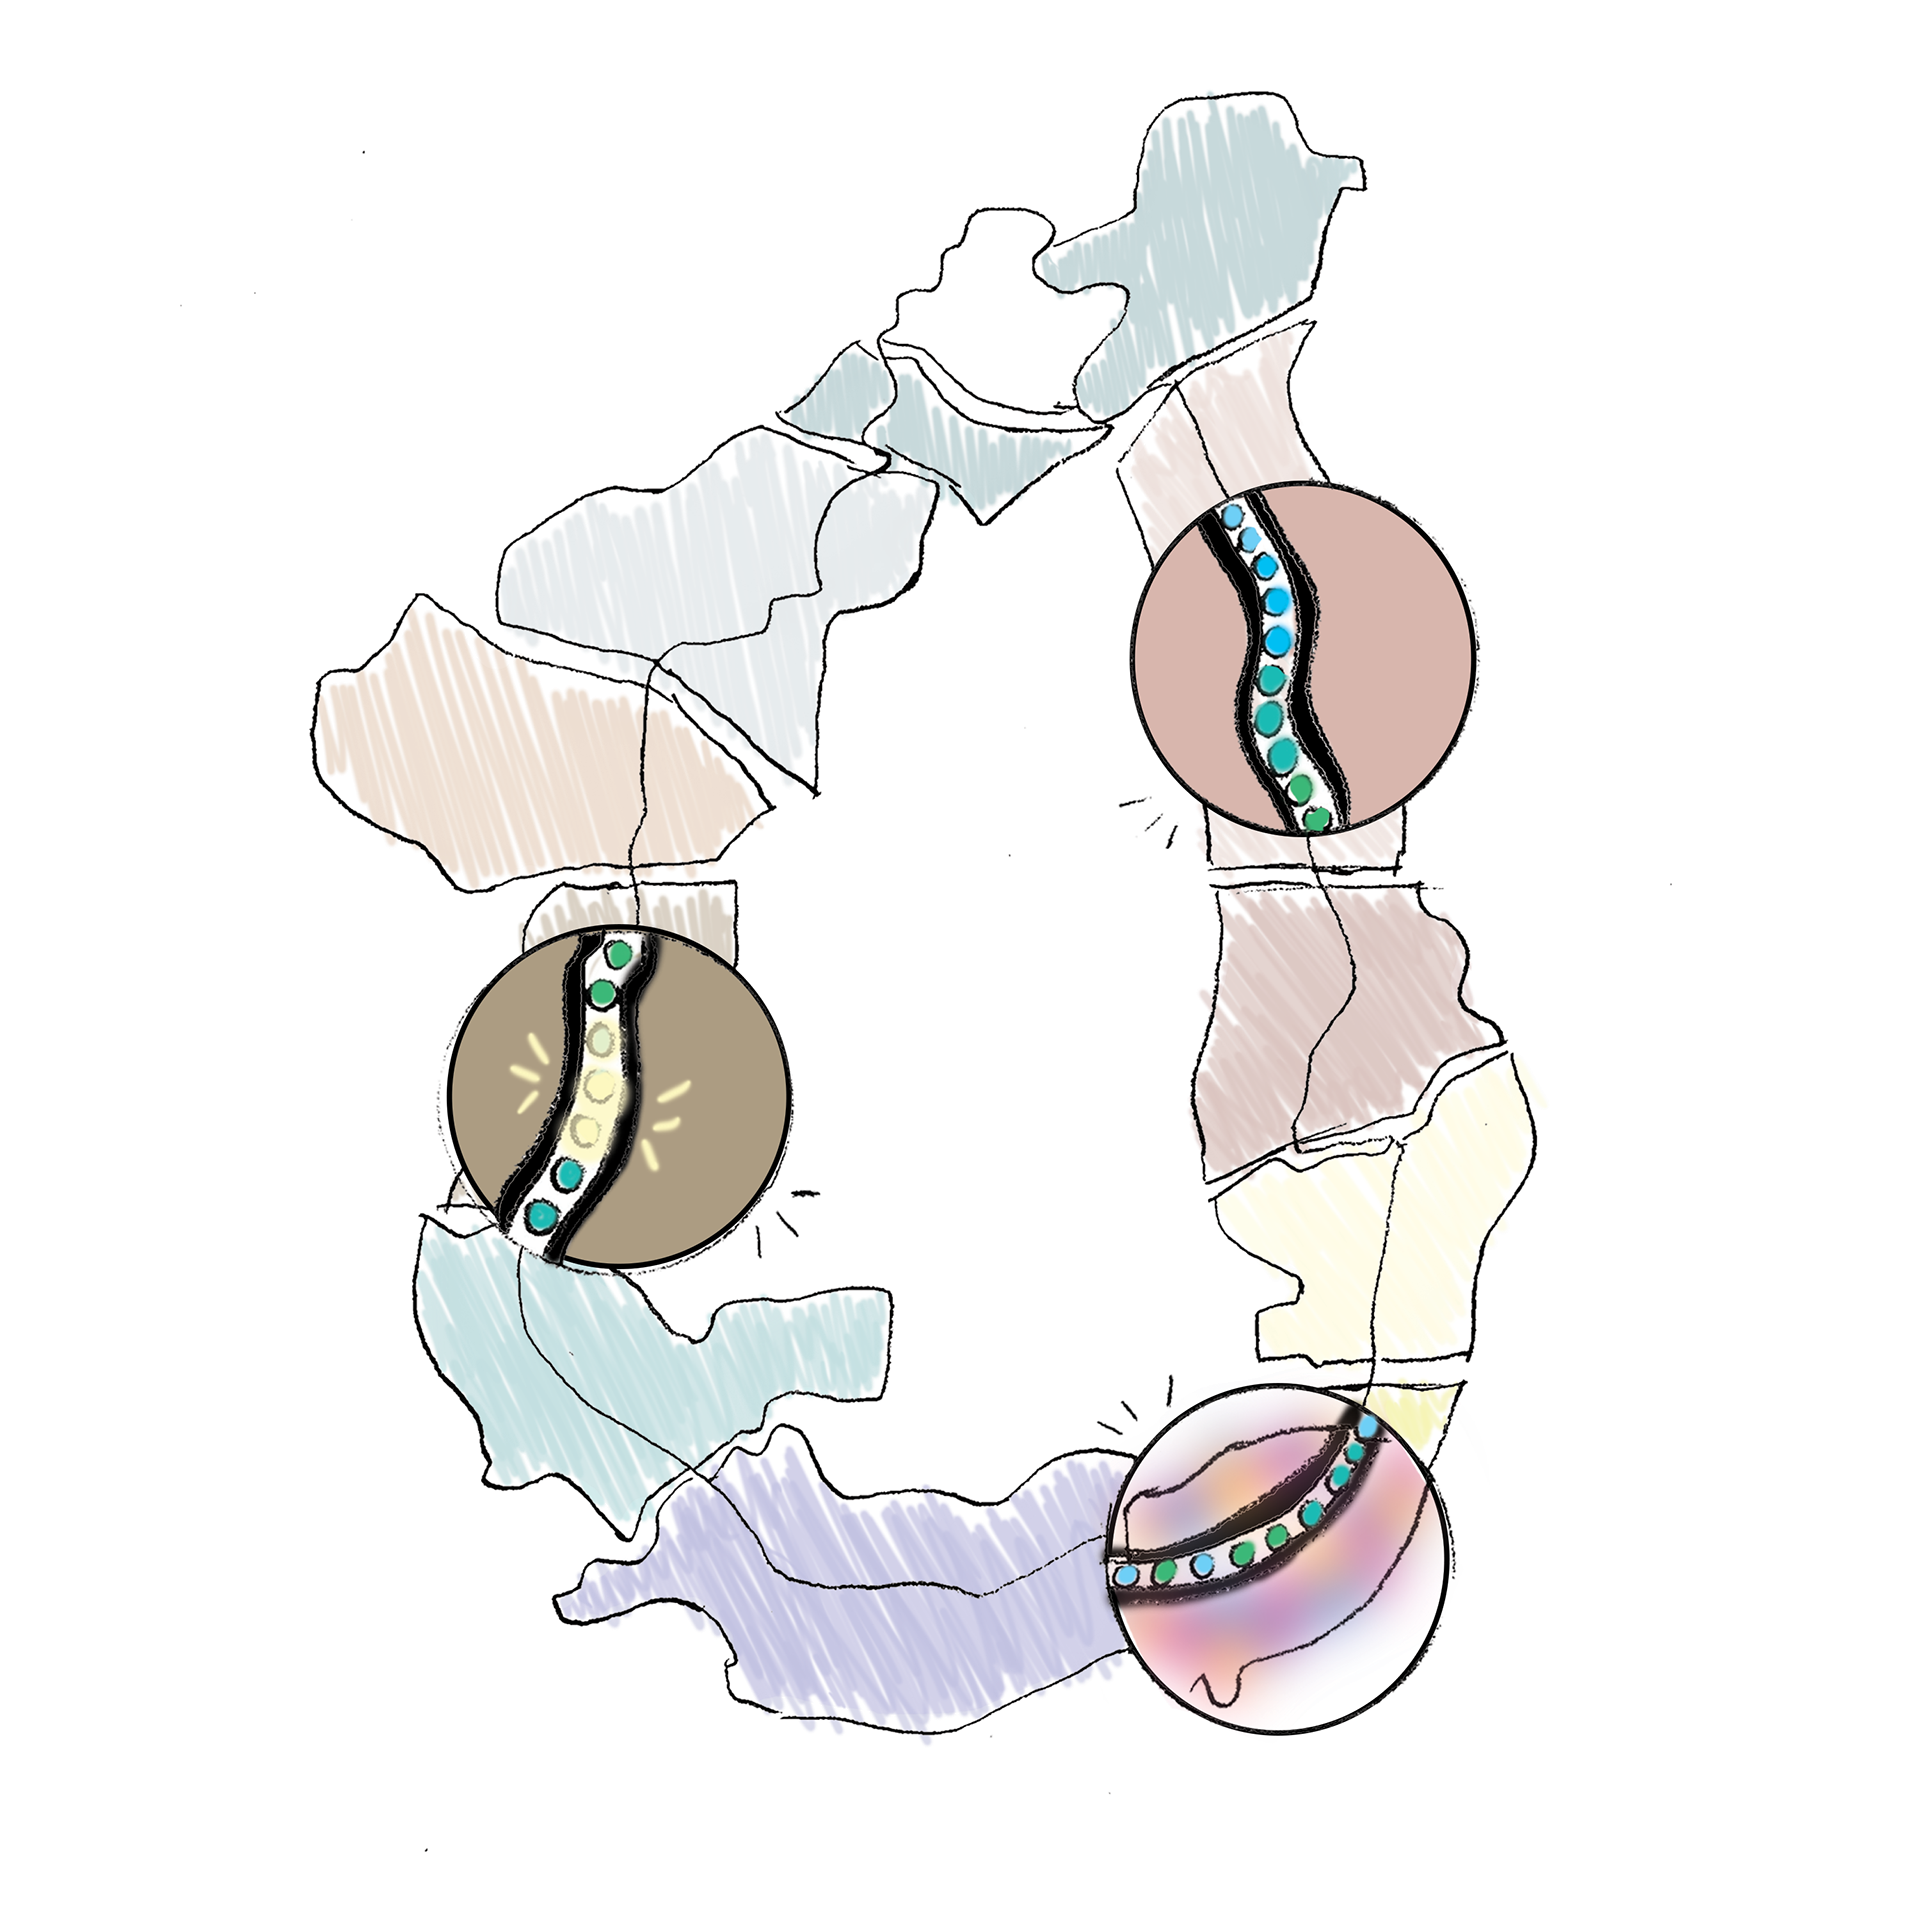
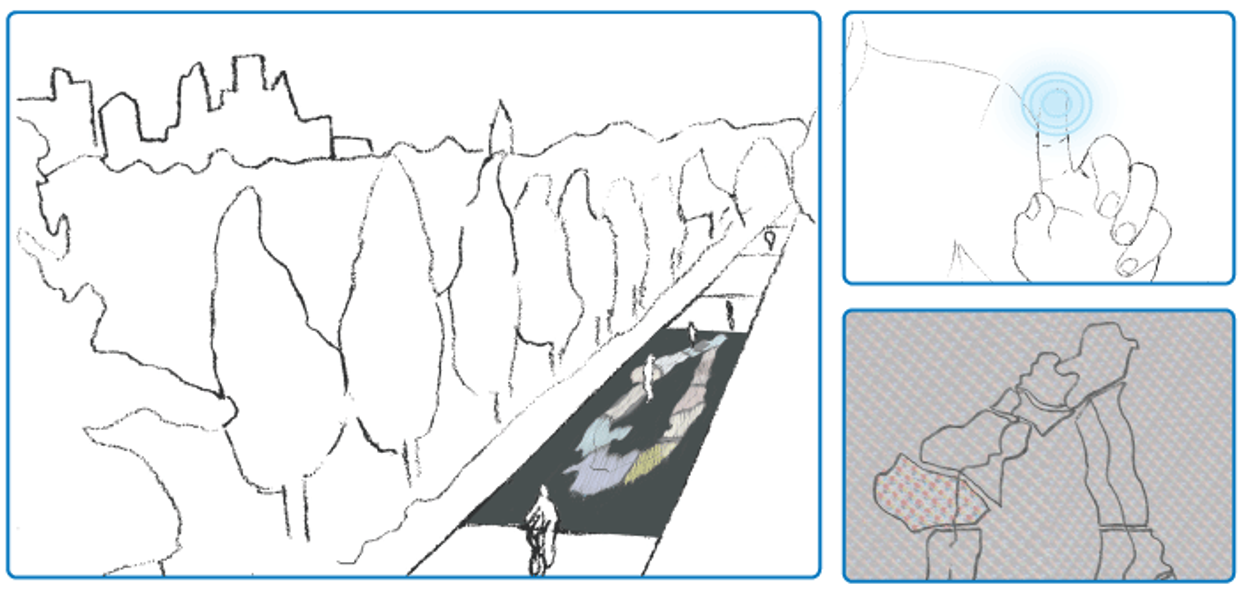
The current installations on the Beltline incorporate no technology, but we envision a future of smart interconnected installations. The installations will utilize the concept of the internet of things. We plan to target informed locations along the proposed connected loop and utilize big data to create interactive map-like experiences to educate users about their surroundings and neighbors through compelling and captivating experiences.
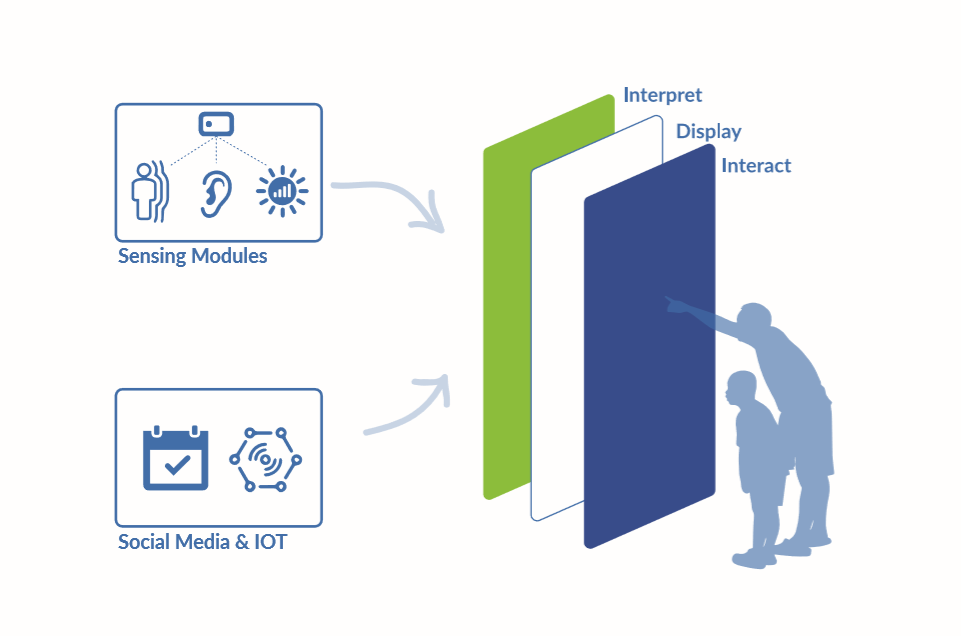
A map display can be both informative as well as experiential for the users. IOT sensors would provide real work data to compliment data gathered from social media to give users a complete context of what is happening.
Implementation
The maps would be implemented along the Beltline at pathway entrances in each neighborhood. The information displayed would be in two main categories- static and dynamic. The static information includes nearby attractions such as parks and distances to public transportation such as the Atlanta Street car and Marta System. The dynamic display is constantly changing and is designed to create curiosity for visitors to explore various areas along the pathway and celebrate the various activities and attractions in each area.
Our vision is to create highly informative, and detailed display of the activities in each neighborhood area and along the BeltLine overall. However, the prototype featured in this documentation is a proof of concept involving LED representations of information. The current prototype is more ambient than literal, but our future work explains the vision for what this installation could display with further time and resources.
Our vision is to create highly informative, and detailed display of the activities in each neighborhood area and along the BeltLine overall. However, the prototype featured in this documentation is a proof of concept involving LED representations of information. The current prototype is more ambient than literal, but our future work explains the vision for what this installation could display with further time and resources.
Prototyping
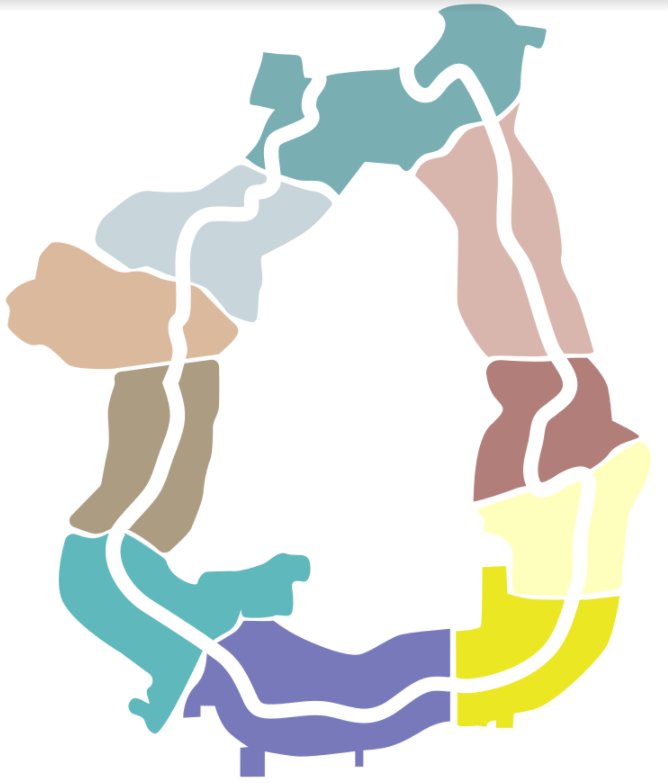
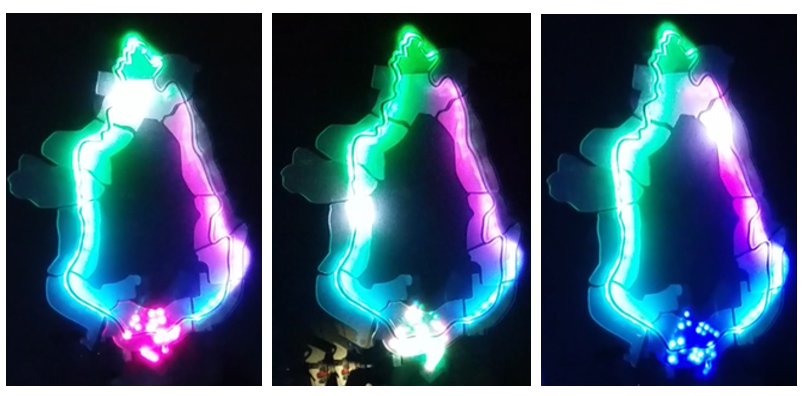
The prototype display is laser cut acrylic map of the BeltLine. Each neighborhood is differentiated by a different color.
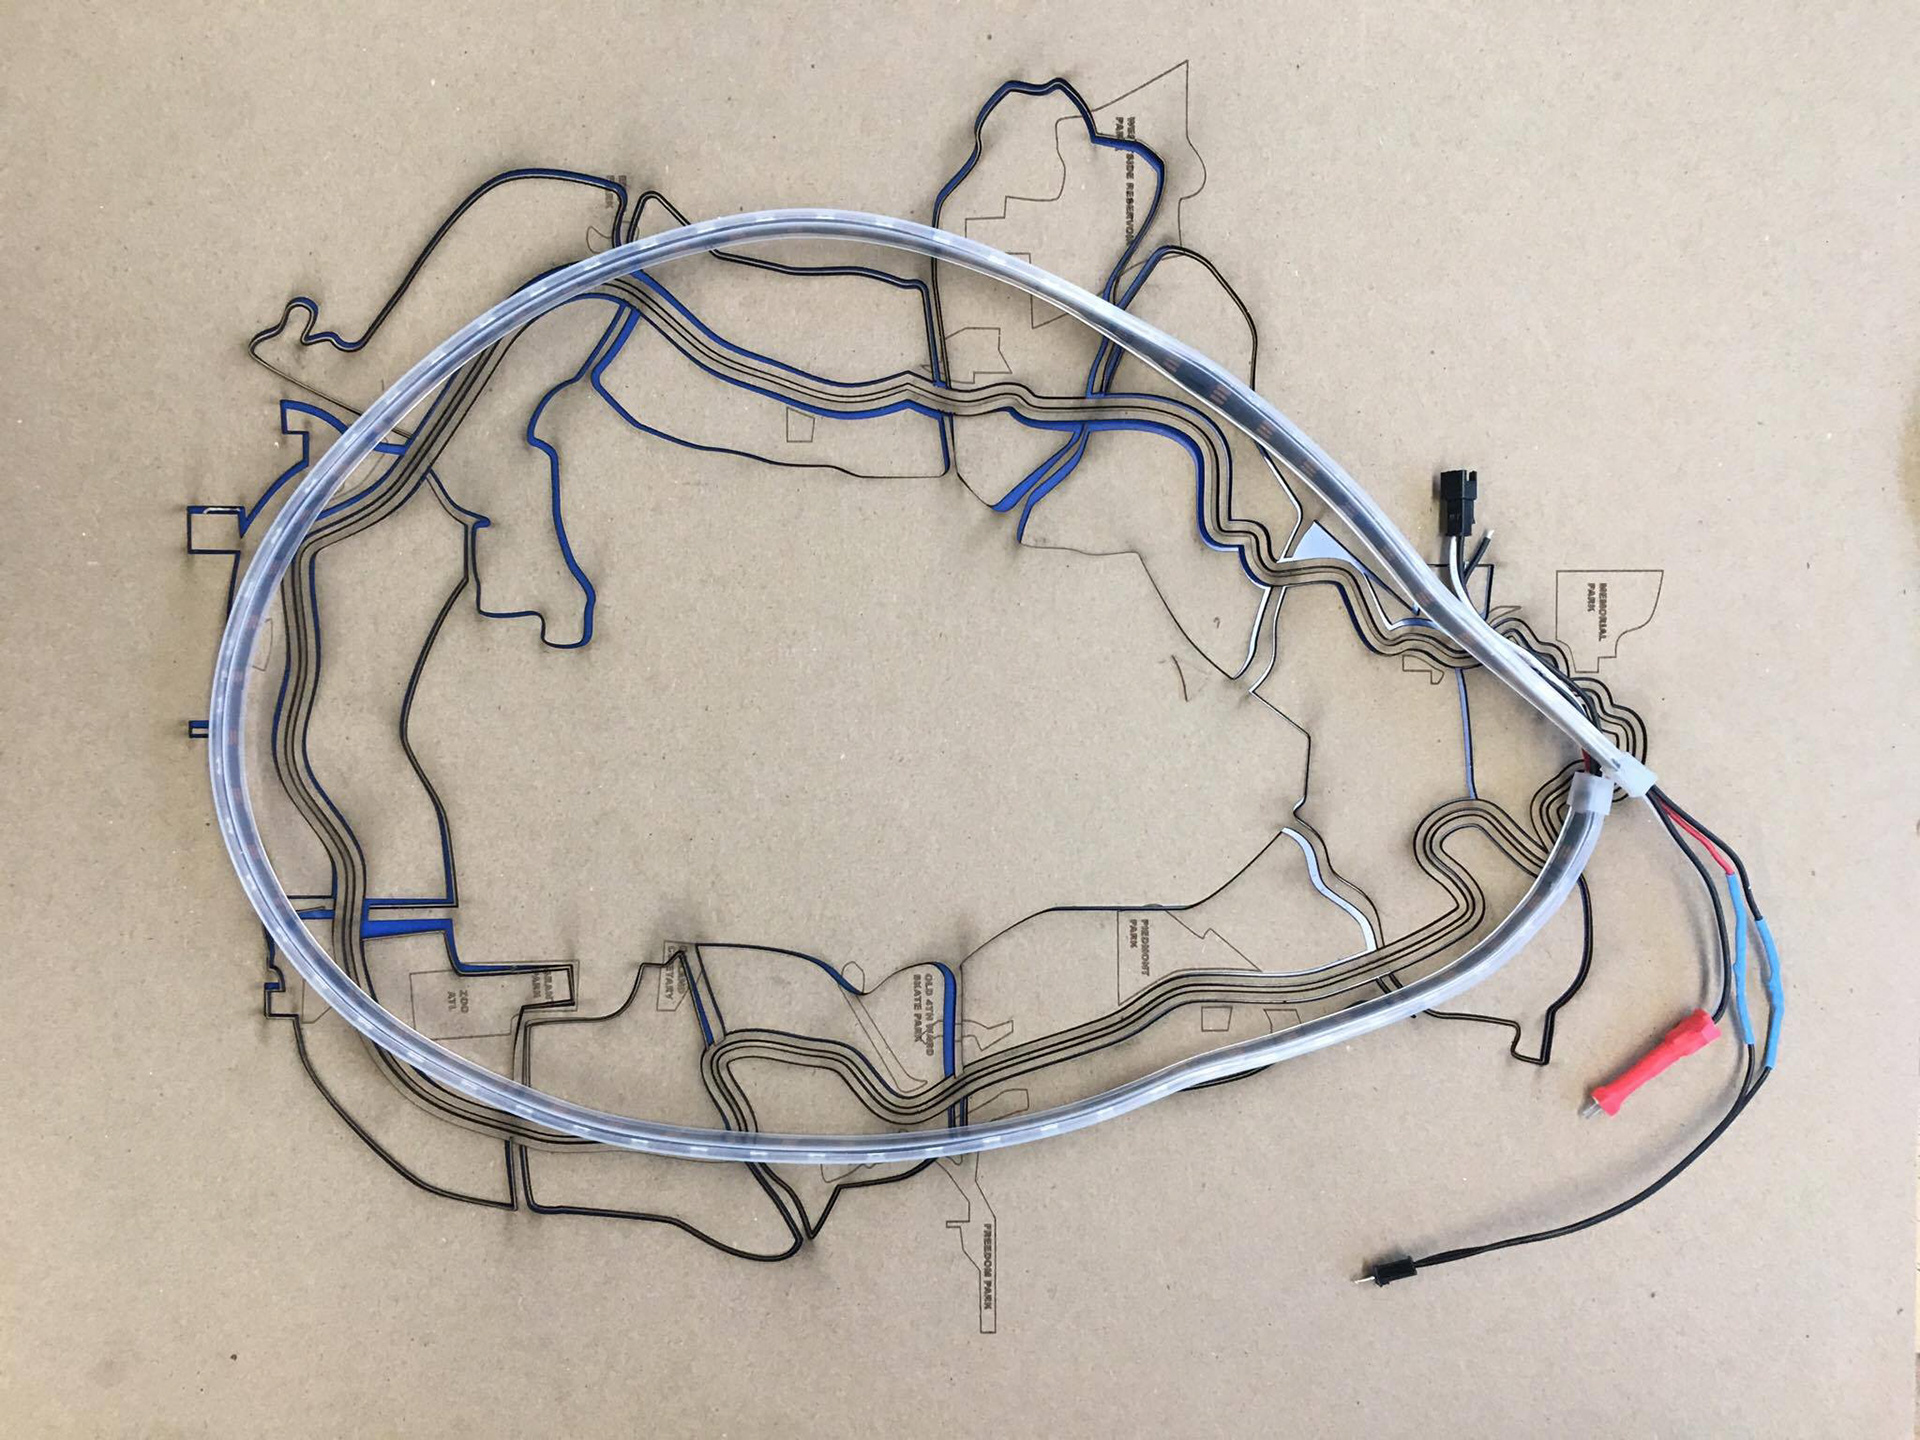

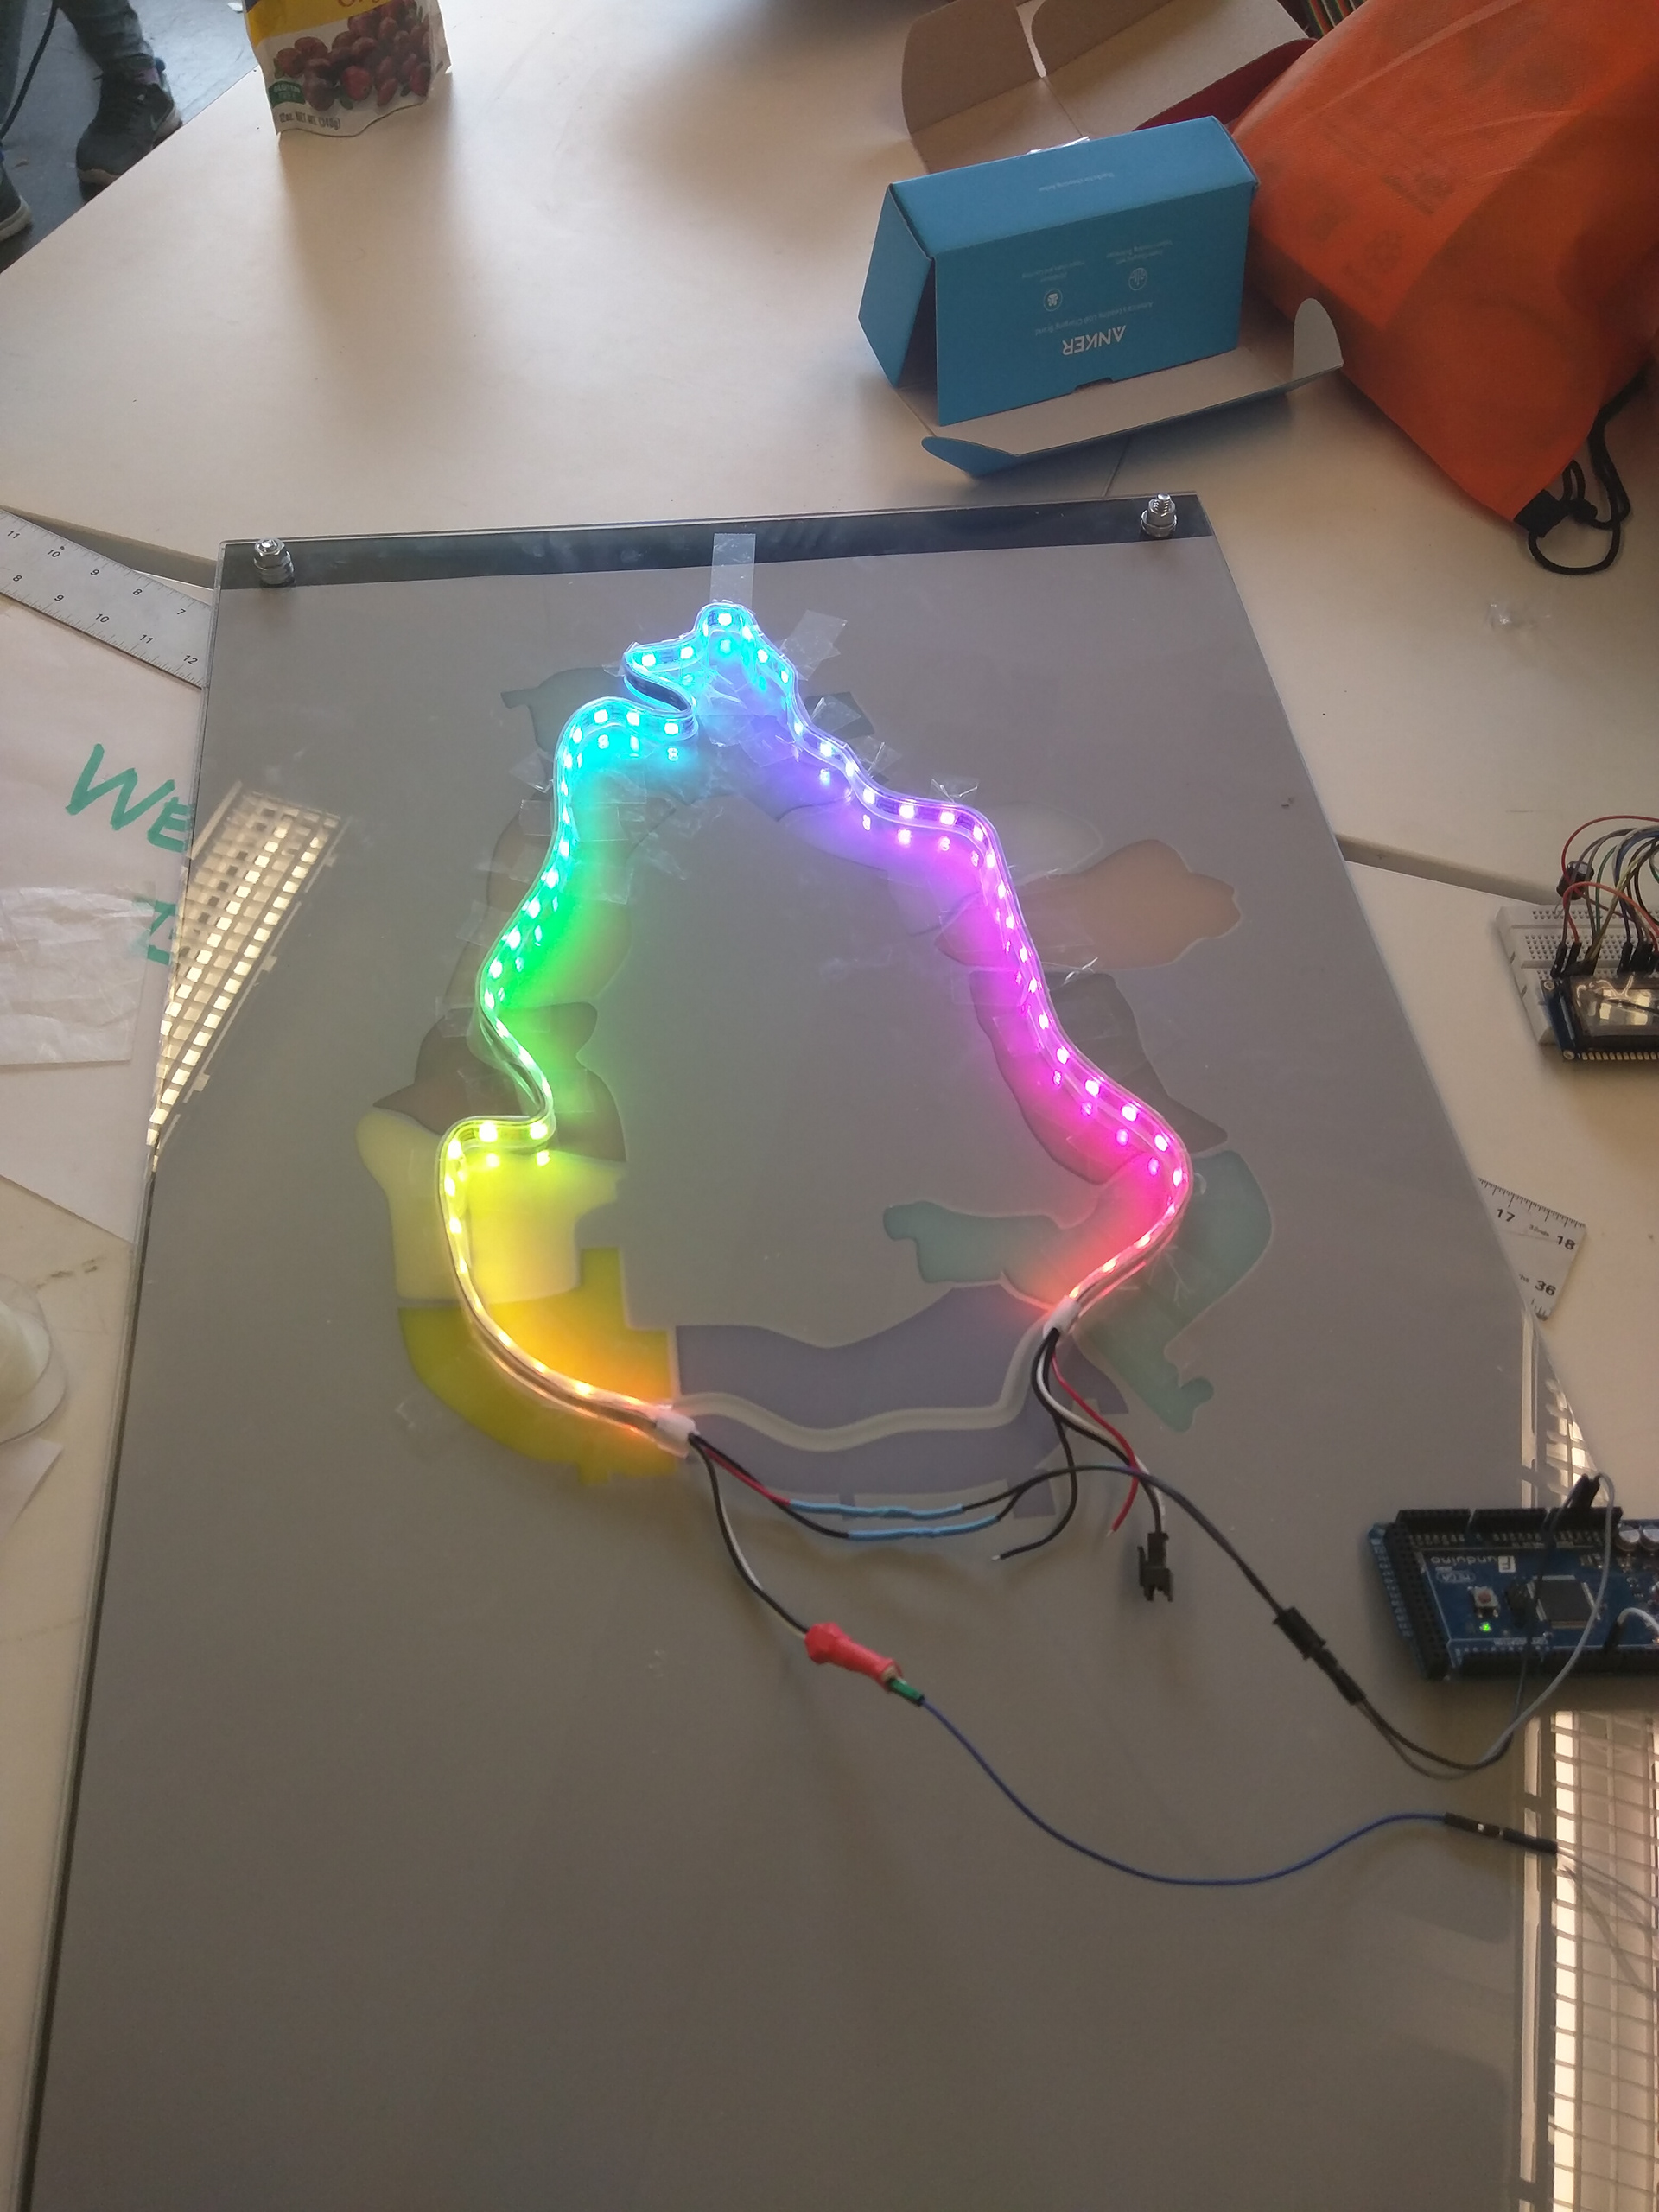
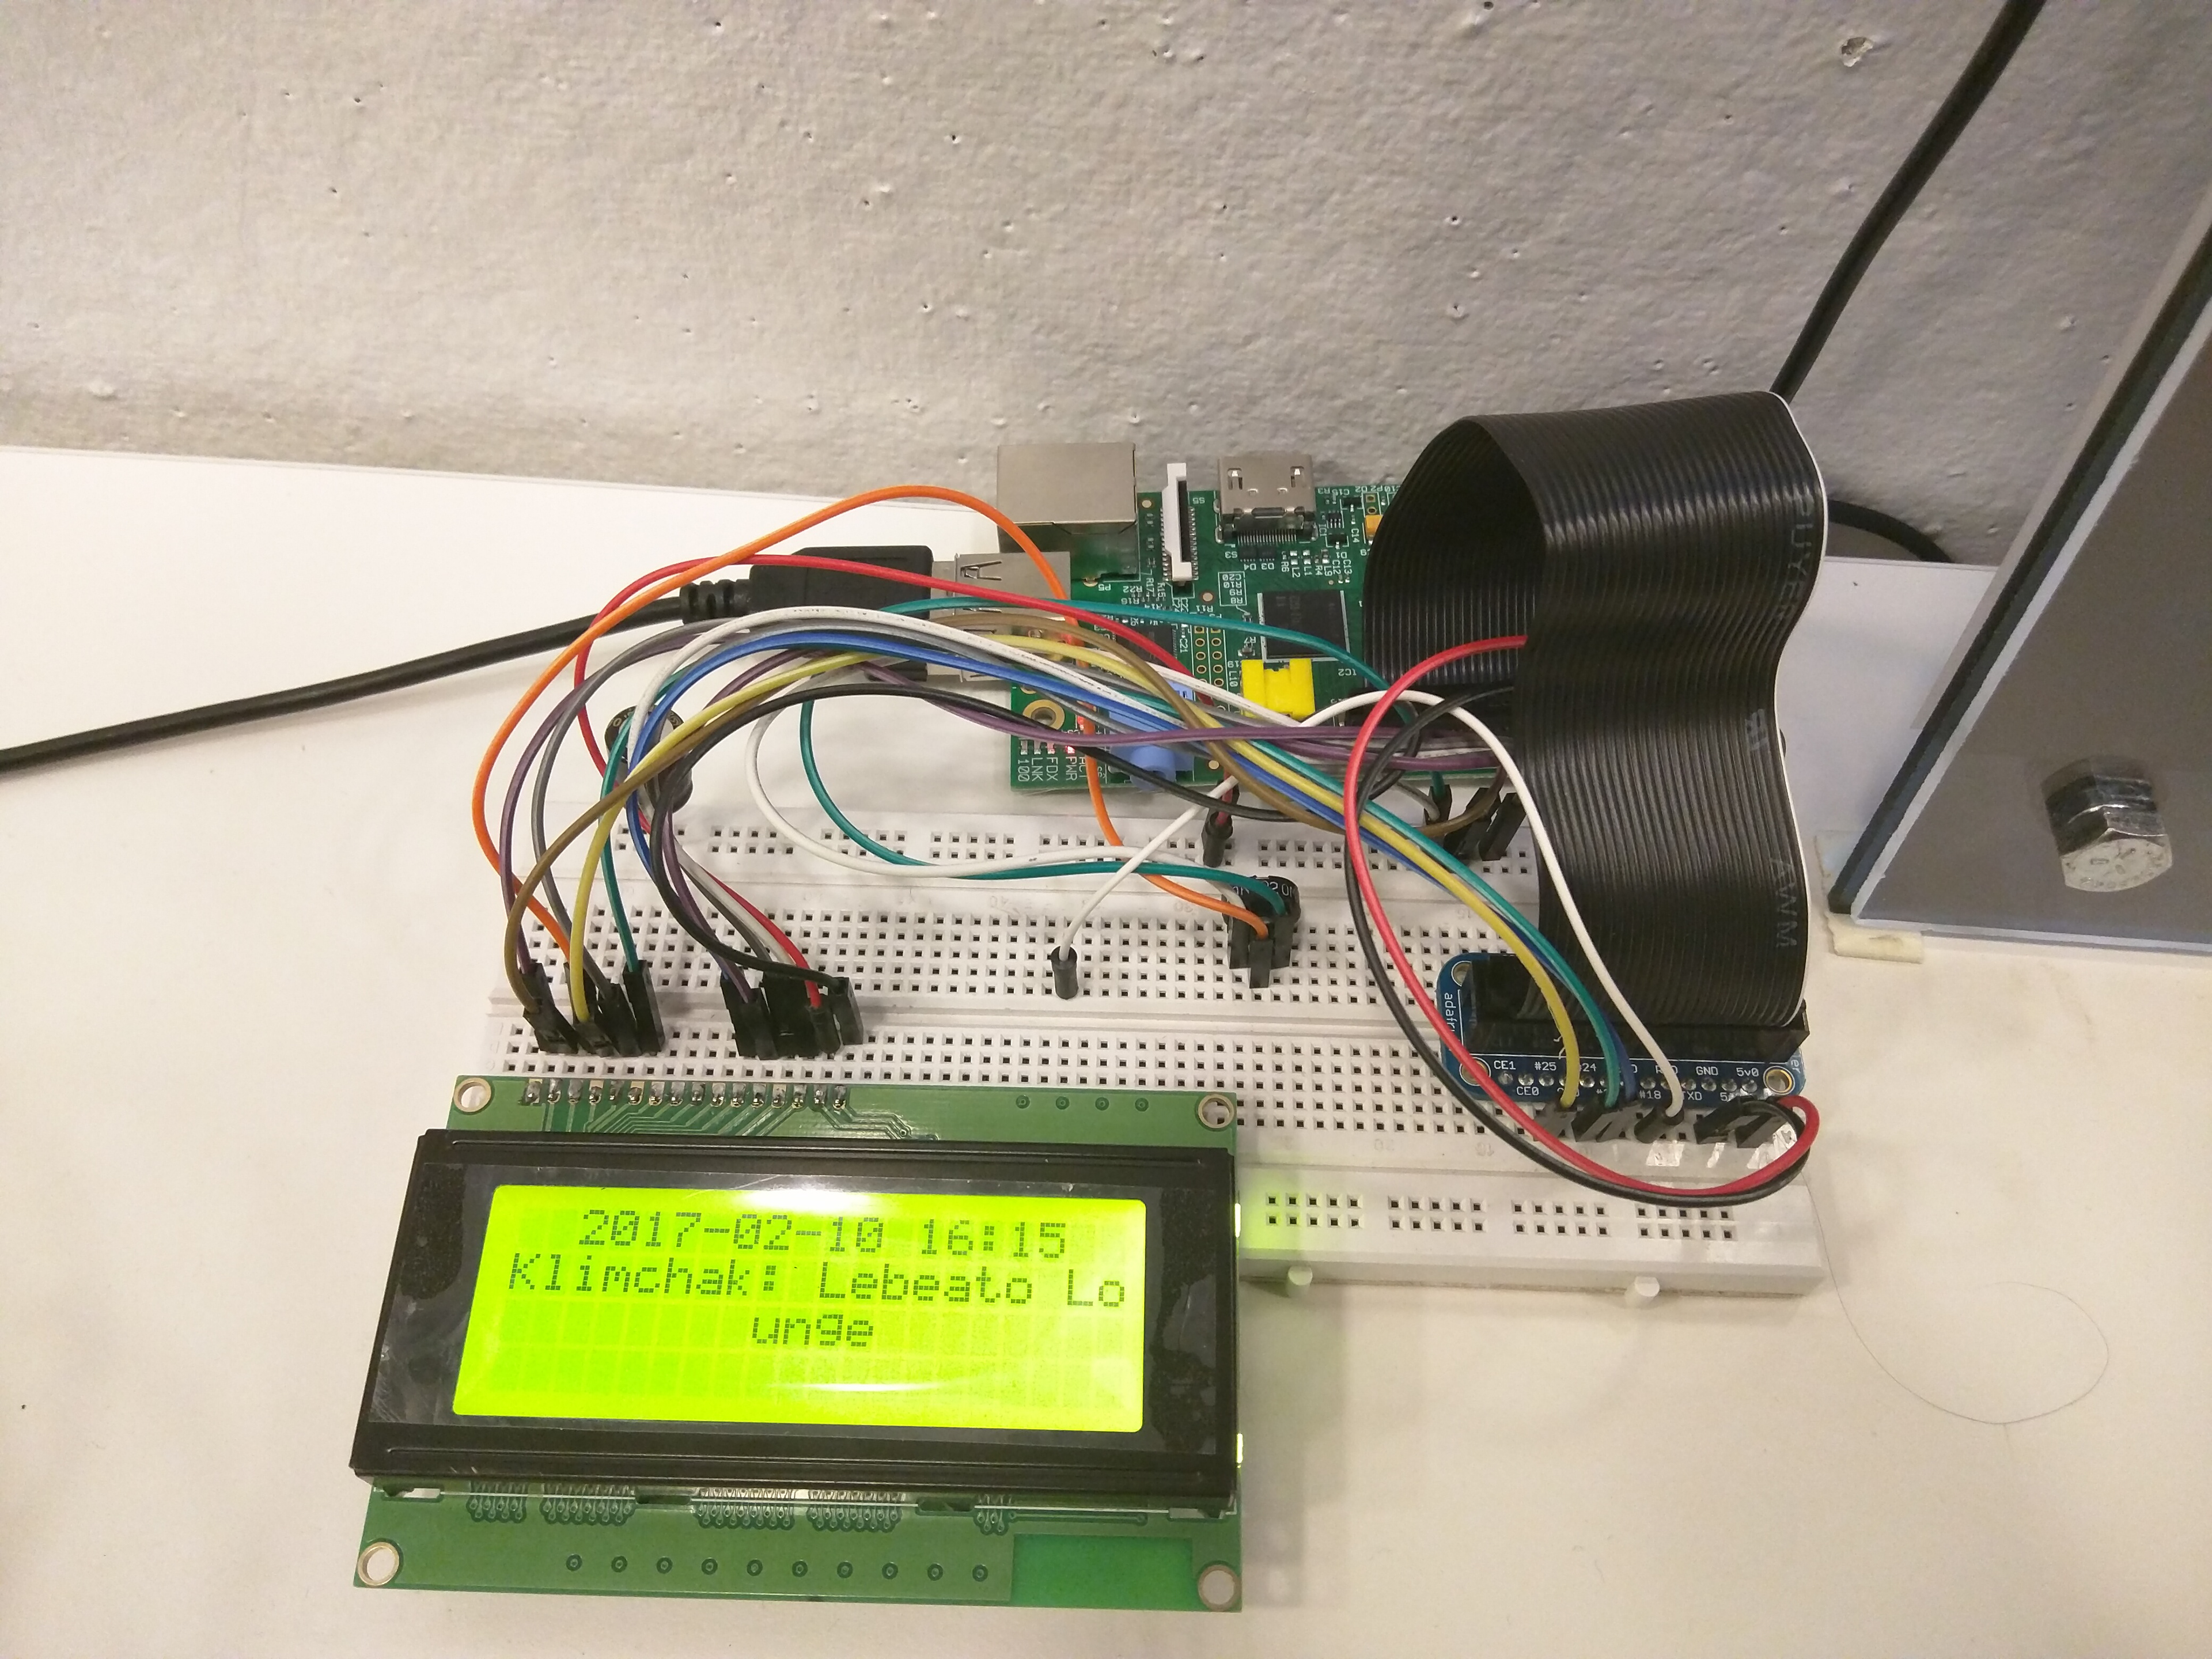
Several electronic systems had to be interconnected to achieve the previously discussed system. The main display was composed of two neo pixel displays and a LCD display. The Neopixel rope was what was employed to trace the path of the beltline and provide colorful visualization to traffic patterns and indicate event data.
This system was controlled by an Arduino Mega and Raspberri Pi. Connecting to Wifi, the raspberry pi scrubbed event data from the Beltline Website along with their approximate locations. Based on the latitude and longitude, the approximate location of said event could be mapped to the Arduino Mega controlling the Neopixel rope. A single led would be turned white along the rope path to indicate the location of the event.
An Auxiliary system controlled the Neopixel matrix at the bottom of the map. This matrix as was meant to represent ambient activity levels in a particular region. In our prototype, we only included one matrix display. However, we imagine in the final product, this matrix would overlay the whole display.
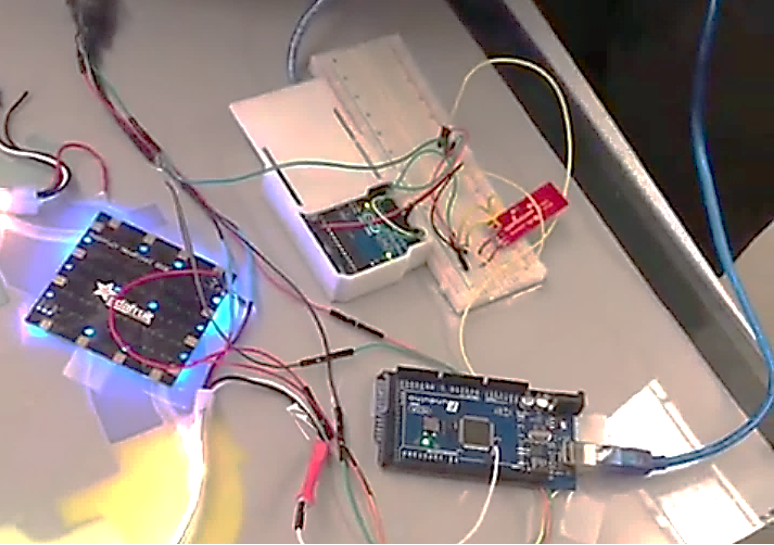
Involved in this system were two Arduino Unos. They were interfaced by two blueSmirf bluethooth modules. Using a master/slave program, the Bluetooth’s were connected to one another to allow data to be transferred long distances between the two arduinos.
Involved in this system were two Arduino Unos. They were interfaced by two blueSmirf bluethooth modules. Using a master/slave program, the Bluetooth’s were connected to one another to allow data to be transferred long distances between the two arduinos.

On the master Arduino, we interfaced the three sensors that would aggregate ambient activity data. This was a light sensor, a proximity sensor, and microphone. We determined that these sensors would be able to provide insight into the environment conditions pertaining to human activity. Each sensor mapped to an intensity of red, green, or blue. High light, motion, noise conditions produces more yellow and orange displays, while quiet, well lit conditions with little proximity stimuli produced a deep green.
Testing
Once the various systems were intertwined, we were able to test our prototype. We were happy with the results. The one sensor unit we built in the prototype was intended to represent activity in one neighborhood. We imagine in a full deployment, hundreds of these sensors would be used to represent activity across the entire park.
Presentation
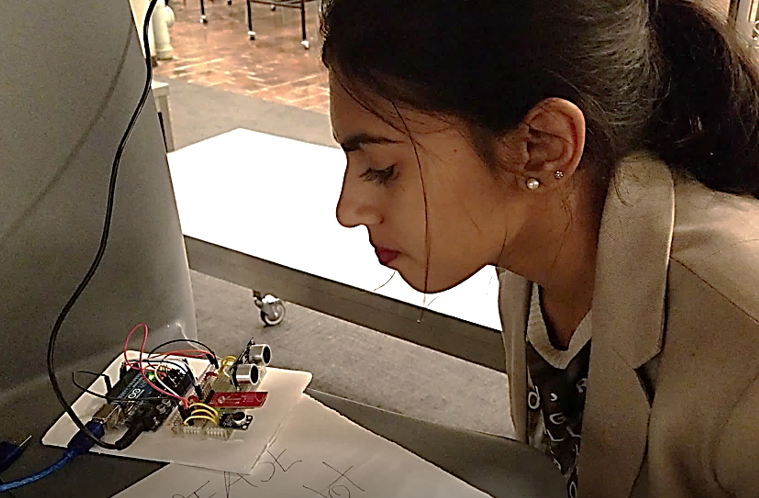
As of January 2018, this project was presented to very positive reception at 3 events. First were the final presentation for the interactive environments class. The second was the Georgia Tech Convergence Innovation competition, where the project one 2nd place in its category. Lastly, we were invited to present our project at the Atlanta Smart Cities symposium.
Demonstrating the interaction for the Interactive Environments class
Footage from the 2017 Spring CIC competition
Being invited to the the Atlanta Smart Cities project was a great opportunity, with many city and business entities expressing interest in furthering this project.

As previously stated, the deliverable of this project is a proof of concept prototype that shows the possibilities of including technology in previously analog interactions. The chosen method for collecting, interpreting and displaying the information could drastically change according to user testing and the team’s particular goals. User testing will hopefully provide valuable insight into interpretability and effectiveness of the information visualization goals of this project. Even the size and shape of the display could be altered to almost any form, but the main message would remain the same. A combination of static and dynamic information would help educate and unify Atlanta by promoting exploration and celebrating each neighborhood equally.
Future
We imagine many options for the future of this project. The future possibilities include integrating the map into the pathway itself, incorporating more interface options on the map itself (such as touch), and integration of a full high definition LED screen to allow the display of even more information. More lights along the BeltLine would add to the system and create a more cohesive mood within each neighborhood, making the whole pathway come alive even at night.
An app or website has also been discussed to provide augmentative and detailed information to users. This would allow users to look up information before visiting or get more details about an event they discover on the map.
Finally, this concept, while conceived for Atlanta, could also be applied to other cities in the future. The interactive maps could be more of a platform to build upon depending on the city or location in question.